The Big Idea
NYC has an abysmal recycling rate, where can policymakers focus
their efforts to improve it?
This project was part of a graduate course at Cornell Tech, INFO
5430 Urban Data. The goal of the course was to discover, process and visualize urban
datasets to answer critical questions faced by cities. Our team's final output was a
data-driven article that elucidates the state of recycling in New York City while offering
insightful policy recommendations based on different Machine Learning models applied to the
relevant datasets.
-
Advisor: Prof. Emma Pierson, Assistant Professor of Computer Science
-
Team: Jeremy Shaffer (Cornell Tech), Rebecca Lassman (Cornell Tech)
-
Timeline: Fall 2021
Note: The proceeding article was co-authored with my good friends and teammates (who also happen to be splendid data scientists), Jeremy and Becca!
We have all had that moment of panic standing in front of the waste bin
holding our lunch trash, facing three choices: ‘paper’, ‘plastic’,
‘landfill’, unsure of which bucket to use. If you’re like us, at this moment
you have probably also wondered: How much of this trash that we so carefully
sort actually gets recycled? If you’re in New York City the answer is,
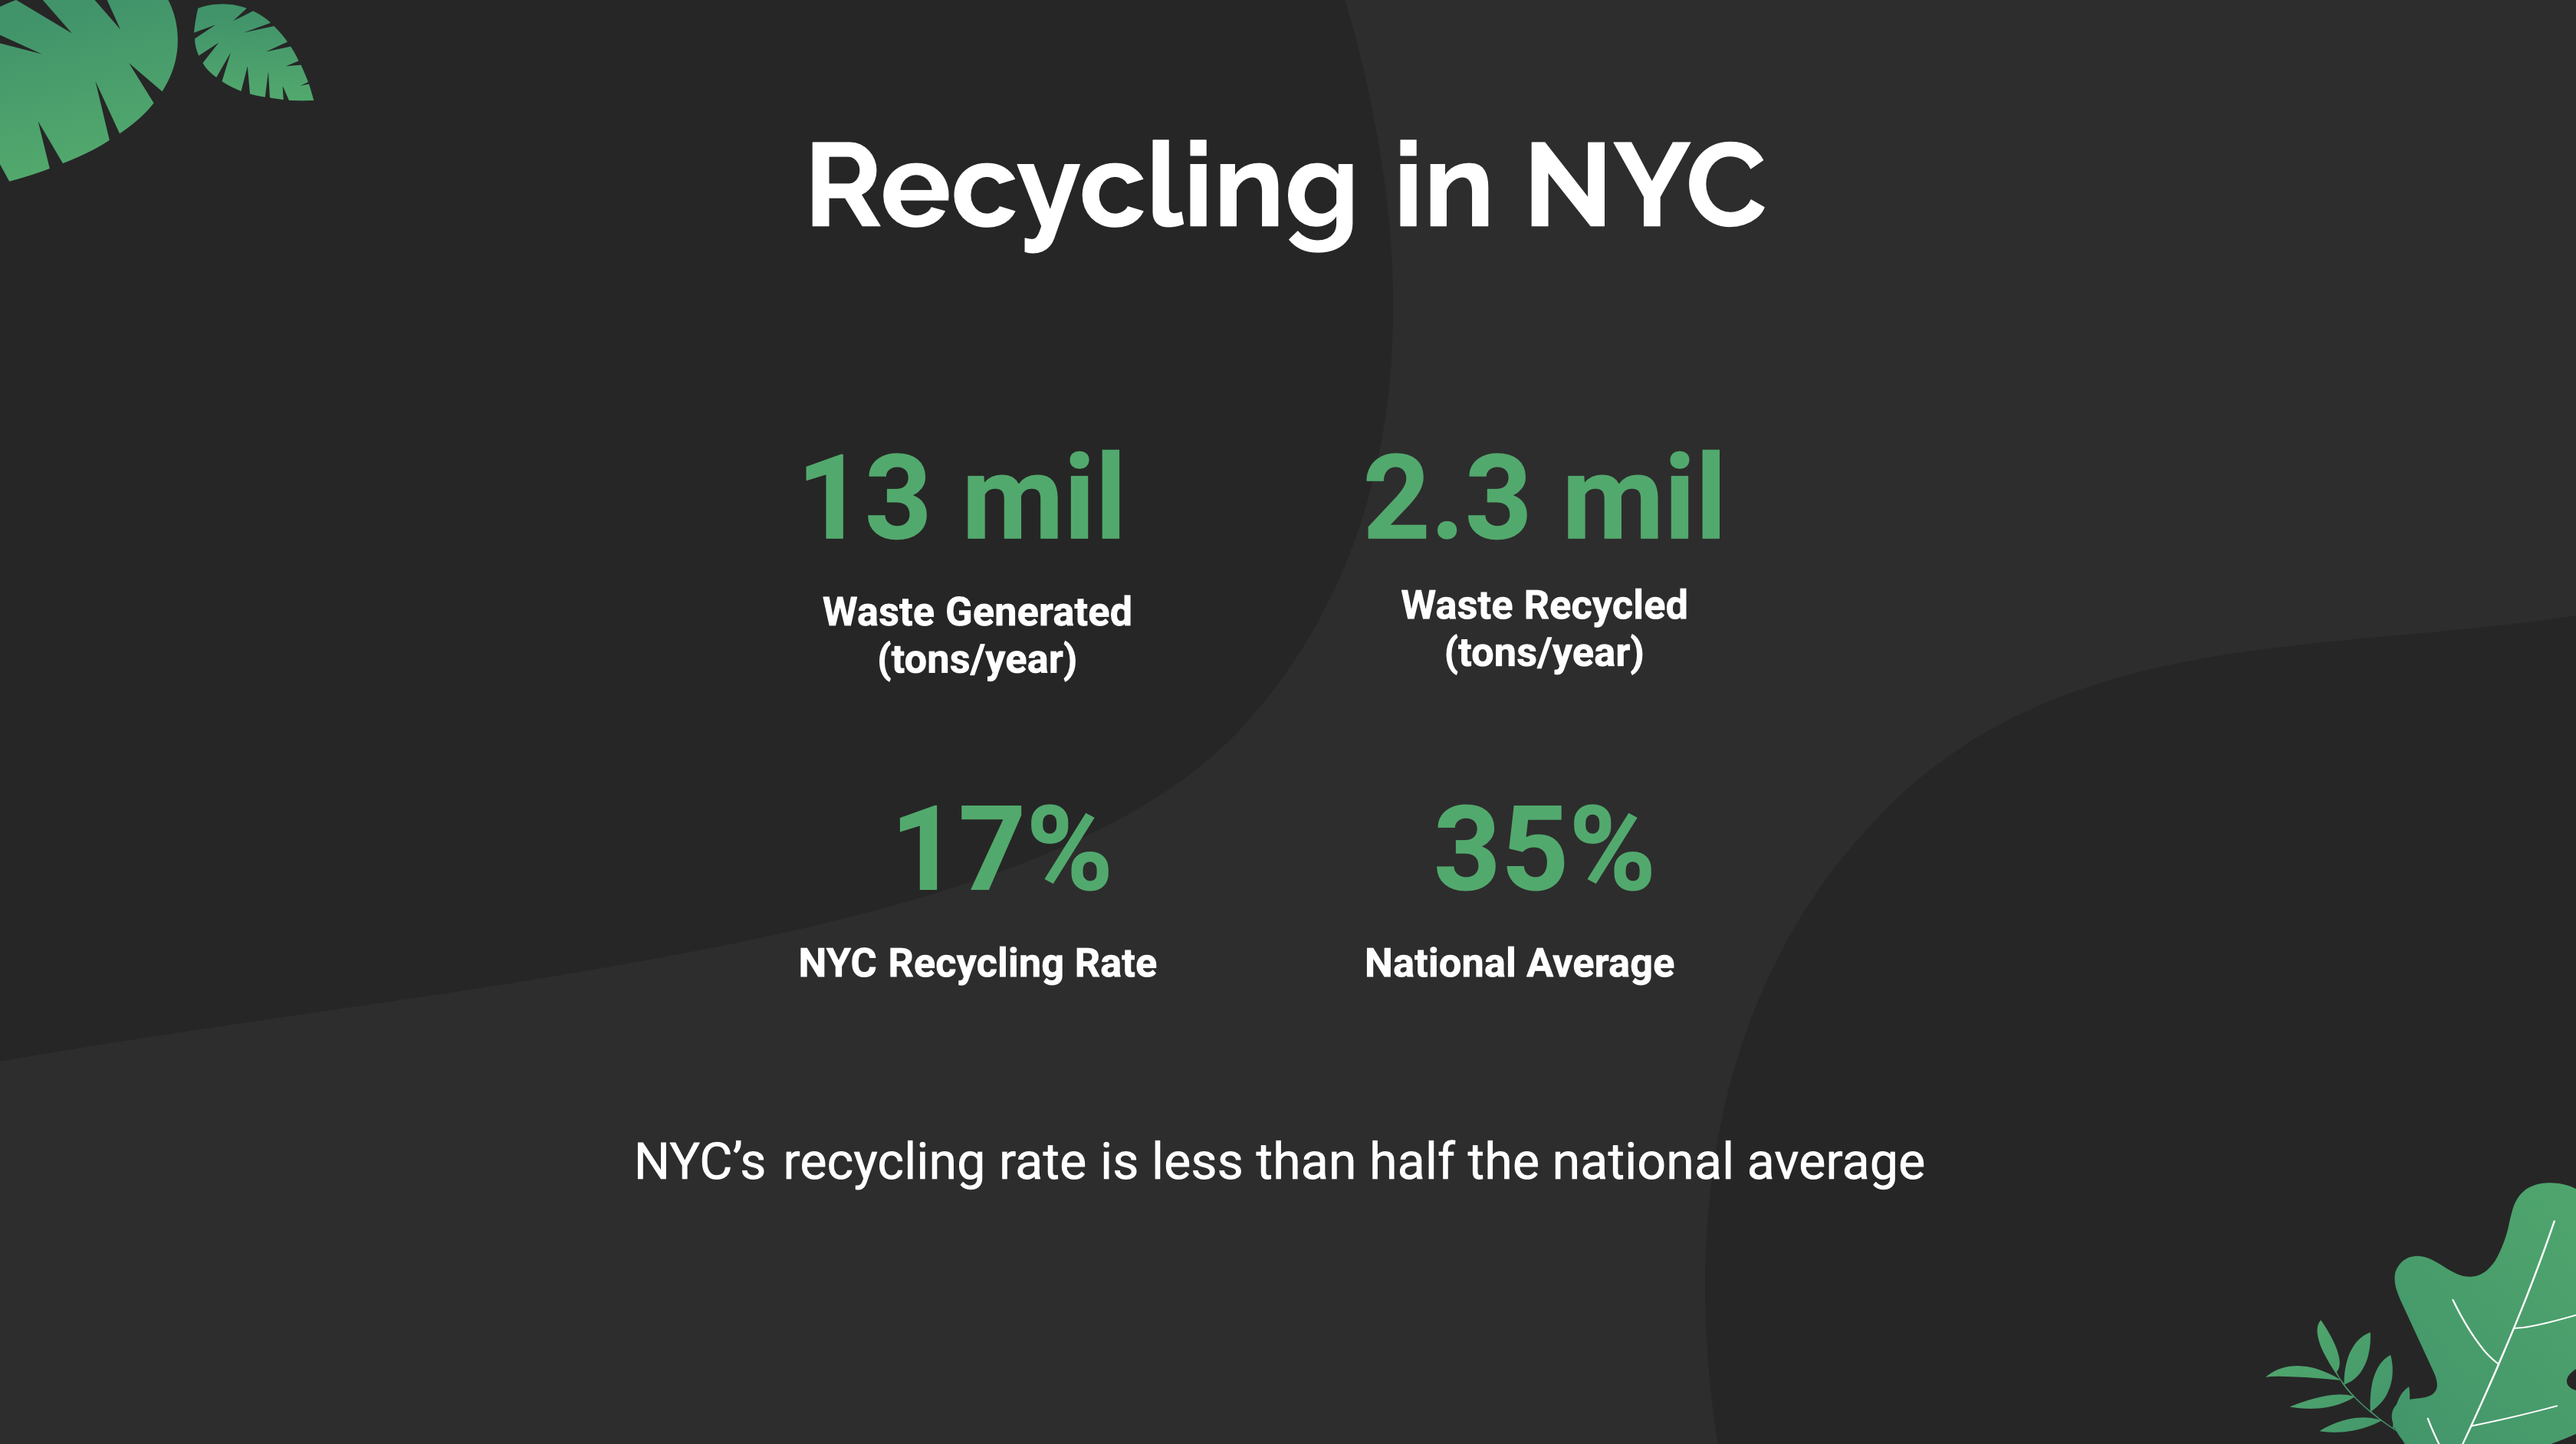
unfortunately, not very much. NYC produces 33 million tons of
waste a year,
more than any other city in the world, and only 17% of that waste
gets
recycled. That is far below the US average of 32%
a year.
In 2013, Mayor Bill de Blasio released One
New York: The Plan for a Strong
and Just City. Under this plan, the city committed to a goal of
sending zero
waste to landfills by 2030. Since the inception of OneNYC, the city has made
incremental steps towards its zero waste goal. While the total waste
produced annually has since marginally reduced, the amount of waste recycled
has remained relatively constant.
The cornerstone of NYC’s recycling efforts is its curbside program, which
collects paper, metal, glass and plastic. There are 2,300
curbside recycling
bins in the city yet only 50 percent of the contents of these bins gets
recycled.
 Well, just whose fault are our poor recycling rates? The city’s, ours or New
Jersey’s? The truth is, it doesn’t matter. Increasing our city’s recycling
rates has large scale benefits and it simply does not get the cool
reputation that it deserves. In 2020, recycling and reuse activities in the
US generated 681,000
jobs, $37.8 billion in wages and $5.5 billion in tax
revenues. This equates to 1.17 jobs for every 1,000 tons of materials
recycled. In terms of environmental sustainability, existing recycling rates
in the US saved 193 million metric tons of carbon dioxide equivalent in 2018
- that’s the same as taking 42 million cars off the road in a year!
Well, just whose fault are our poor recycling rates? The city’s, ours or New
Jersey’s? The truth is, it doesn’t matter. Increasing our city’s recycling
rates has large scale benefits and it simply does not get the cool
reputation that it deserves. In 2020, recycling and reuse activities in the
US generated 681,000
jobs, $37.8 billion in wages and $5.5 billion in tax
revenues. This equates to 1.17 jobs for every 1,000 tons of materials
recycled. In terms of environmental sustainability, existing recycling rates
in the US saved 193 million metric tons of carbon dioxide equivalent in 2018
- that’s the same as taking 42 million cars off the road in a year!
We need to be smarter about our recycling and waste initiatives, and one way
to do that is to use data to examine community recycling behaviors. This
approach could help us provide recommendations to city officials on how they
can better allocate resources to improve citywide recycling rates.
Having to sieve through 33 million tonnes of waste to collect data, though a
joy for the many rats in our city, is probably an unsettling task for most
data scientists. Thankfully, the New York Sanitation Department (DSNY) has
published monthly waste and recycling data since 2016. Since DSNY provides
free, regularly scheduled curbside trash collection to every residence and
public building in the city, they are able to measure the tonnage of waste
produced in each community district. Unfortunately, if you run a commercial
or industrial business, you do have to hire your own private haulers to
manage your waste or risk having some furry four-legged visitors!
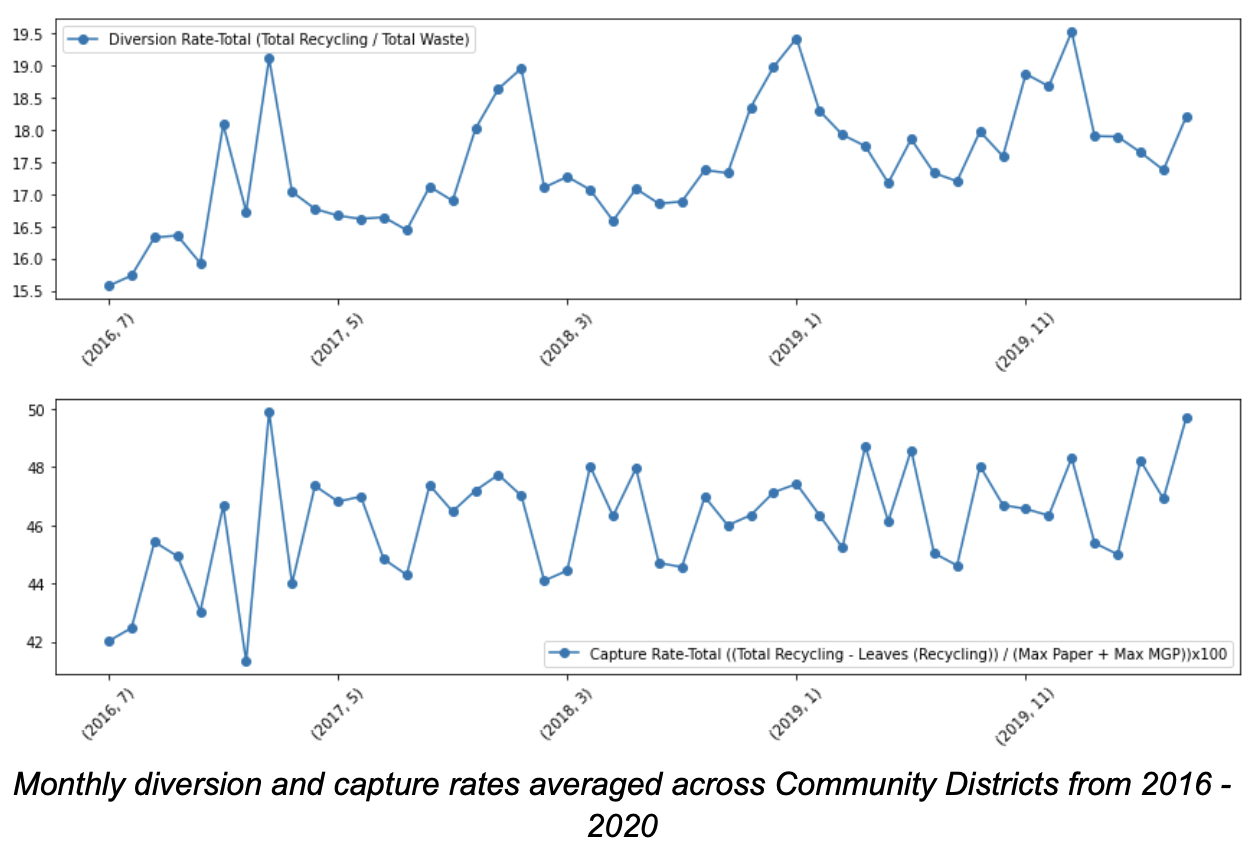
 Besides measuring a simple breakdown of trash, DSNY also calculates two
useful recycling metrics that tell us about the health of recycling in the
city at any given time. The diversion rate calculates the amount of
materials put in recycling bins as a fraction of total waste. In other words
it tells us how much of the city’s waste is sent to recycling plants. As
many of us would not like to admit, sometimes we accidentally (or
not-so-accidentally) discard non-recyclable materials into the recycling bin
as opposed to the landfill bin. This information is accounted for by the
capture rate. The capture rate is the amount of materials actually recycled
as a percentage of the total material sent to the recycling plant.
Besides measuring a simple breakdown of trash, DSNY also calculates two
useful recycling metrics that tell us about the health of recycling in the
city at any given time. The diversion rate calculates the amount of
materials put in recycling bins as a fraction of total waste. In other words
it tells us how much of the city’s waste is sent to recycling plants. As
many of us would not like to admit, sometimes we accidentally (or
not-so-accidentally) discard non-recyclable materials into the recycling bin
as opposed to the landfill bin. This information is accounted for by the
capture rate. The capture rate is the amount of materials actually recycled
as a percentage of the total material sent to the recycling plant.
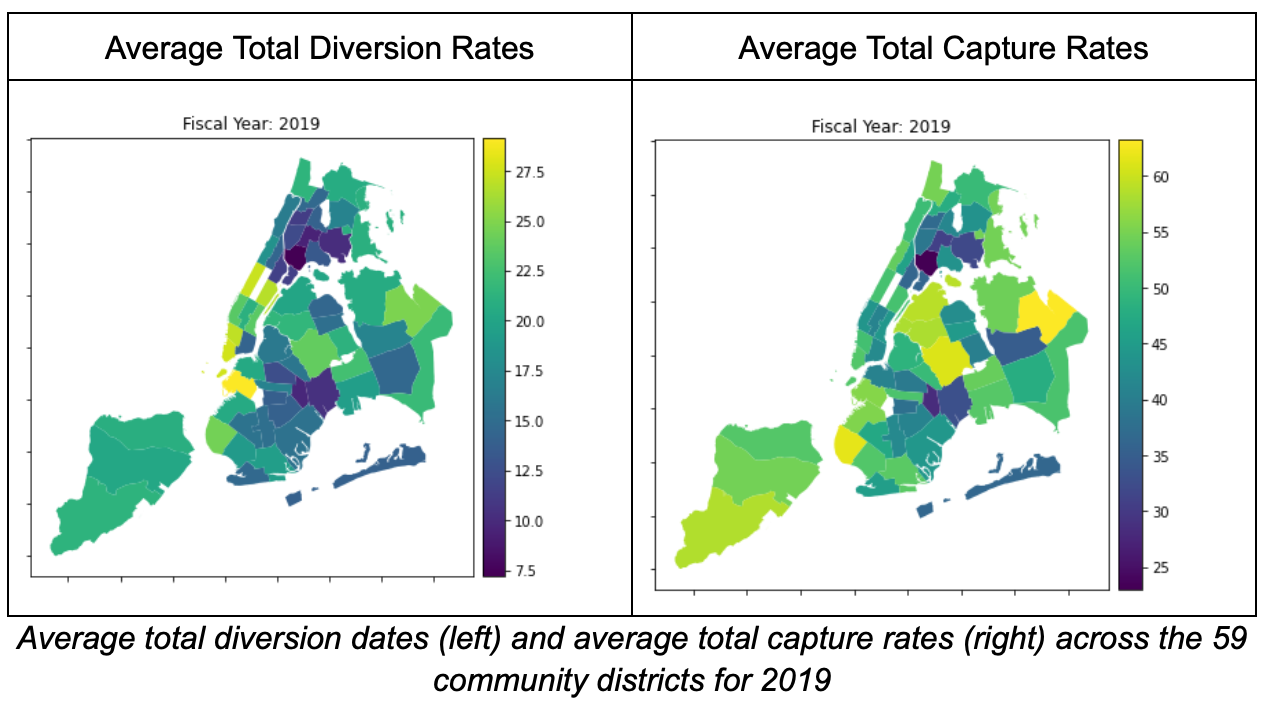
We were interested to see if these rates were uniform across NYC or, if
different, were they correlated with factors such as population density,
assessment value, income, educational attainment and land use. So, we took a
look at the 59 community districts across all five boroughs.
Looking at this data we see that over the four year period from 2016 - 2020
average monthly diversion rates by Community District vary significantly,
from a 6.8% diversion rate in Community District 1 in the Bronx (which
includes Mott Haven, Melrose, and Port Morris neighborhoods) to 29.6%
diversion rate in Community District 6 in Brooklyn (which includes Red Hook,
Carroll Gardens, Park Slope, Gowanus, Cobble Hill and Columbia Street
Waterfront District neighborhoods).
A similar spread is seen in capture rates. Again, Community District 1 in
the Bronx has an average capture rate of just 22% compared to 68.8% in
Queens Community District 11 (which includes the neighborhoods of Bayside,
Douglaston–Little Neck, Auburndale, East Flushing, Oakland Gardens and
Hollis Hills)
 We thought there might be four variables that influence community recycling
behaviors: income, education, population density, and land value. We were
interested in these four features because we believed that they might
provide insight into the reasons behind differing recycling rates across
community districts. While we thought that income and education would be
positive predictors of recycling rates, we wondered if population density
and land value might negatively predict recycling rates.
We thought there might be four variables that influence community recycling
behaviors: income, education, population density, and land value. We were
interested in these four features because we believed that they might
provide insight into the reasons behind differing recycling rates across
community districts. While we thought that income and education would be
positive predictors of recycling rates, we wondered if population density
and land value might negatively predict recycling rates.
Indeed, our analysis shows that there is a weak but statistically
significant negative relationship between population density and diversion
rates. This relationship is even more pronounced with capture rates, where
the negative relationship is over 5 times stronger.
As expected, income and educational attainment are all positive predictors
of both diversion and capture rates. Land value, on the other hand, is only
a positive predictor for diversion rate; it is not a statistically
significant factor for capture rates.
Most interestingly is that, when controlling for income, education, and land
value, population density is no longer a statistically significant factor
for diversion rates but it is still statistically significantly negatively
associated with capture rates. To put it more clearly, while population
density may not impact how much waste a community recycles, it does
correlate with a decrease in how well the community recycles.
We often equate denser communities - and cities specifically - with more
sustainable living. However, these results show that when it comes to waste
management this may not always be true. It is not hard to imagine that as
people live in closer quarters and higher highrises, the systems we have in
place to efficiently separate recycles from trash may be overwhelmed.
Perhaps a renewed vision for recycling infrastructure in cities, such as a
pneumatic tube network (like the one on Roosevelt Island) for recyclables.
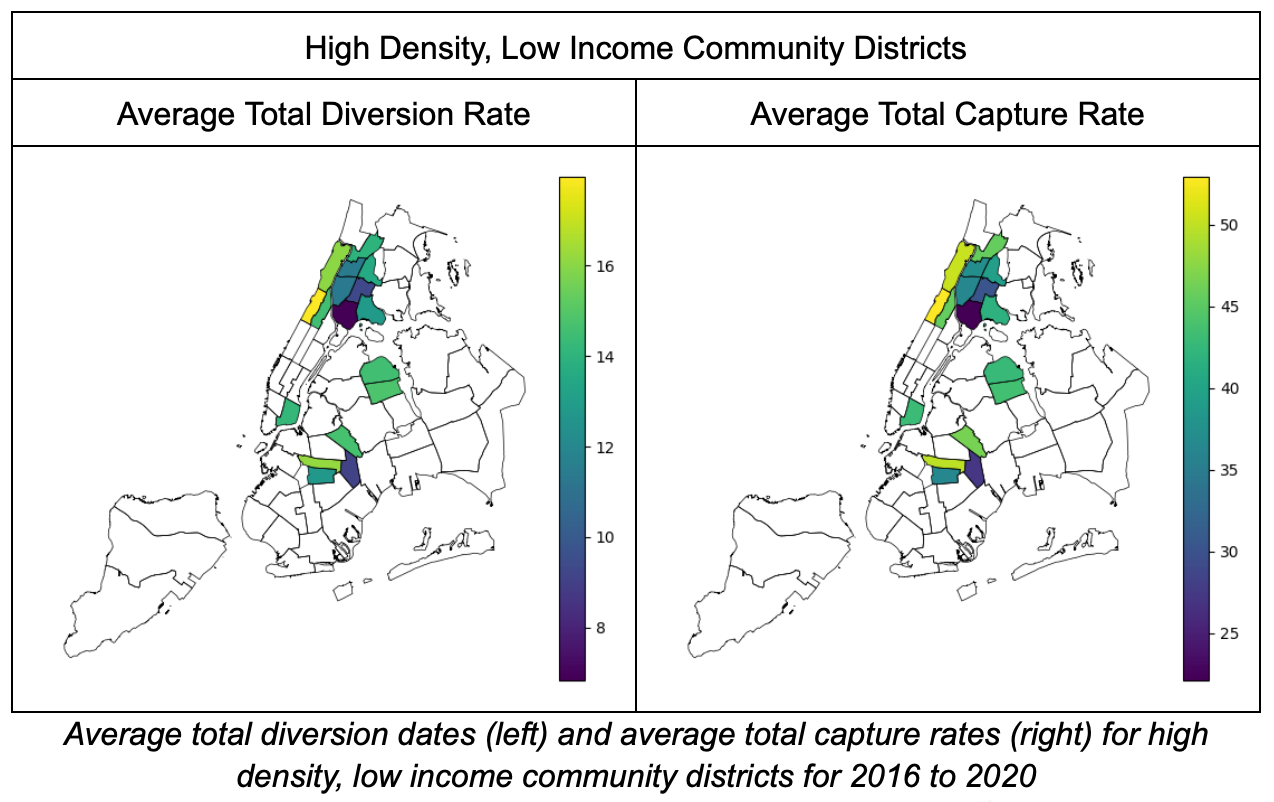
Furthermore, when splitting community districts into high income (more than
32% make more than $100,000) and low income (less than 32% make $100,000)
and controlling for education and land value, population density is actually
a positive predictor of diversion rates for high income community districts
and a negative predictor of diversion rates for low income communities. What
this tells us is that targeted recycling initiatives would have the highest
impact by focusing on high density, low income neighborhoods.
 Recently, in a bid to weather a budget shortfall due to the COVID-19
pandemic, Mayor Bill de Blasio and the City Council cut $106
million from
the Department of Sanitation’s budget. With limited resources available, it
becomes even more important to be able to make data-driven policy decisions
to improve recycling rates. It is not sufficient to have more recycling bins
- they should be placed in specific community districts in the Manhattan,
Bronx and Brooklyn. It is not sufficient to have more outreach programs -
they should perhaps be targeted towards high density, low income
neighborhoods.
Recently, in a bid to weather a budget shortfall due to the COVID-19
pandemic, Mayor Bill de Blasio and the City Council cut $106
million from
the Department of Sanitation’s budget. With limited resources available, it
becomes even more important to be able to make data-driven policy decisions
to improve recycling rates. It is not sufficient to have more recycling bins
- they should be placed in specific community districts in the Manhattan,
Bronx and Brooklyn. It is not sufficient to have more outreach programs -
they should perhaps be targeted towards high density, low income
neighborhoods.
If you found this article interesting and are driven to continue as a data
pioneer for the recycling industry, we would recommend looking into the
following areas for extensions of this work:
(1) Commercial recycling rates
This dataset only captures residential recycling rates. In dense commercial
office areas like midtown, we would expect commercial waste to account for a
significant portion of the neighborhood’s overall waste. Therefore
developing strategies to collect this information could provide meaningful
new insight.
(2) Location of recycling assets
While we did not explore the spatial relationship between existing recycling
assets (recycling bins, recycling centers, collection days etc.) and
neighborhoods recycling rates, this could provide interesting suggestions
for future policy decisions relating to placement of these assets.